RESEARCHER. DESIGNER. THINKER.
Joseph D. Hooper, PhD
I am a Cultural Studies Methodologist working in the team member experience and service design space. I combine the iterative design thinking process with the perspectives, methods, and theories of numerous fields of study to approach complex problems.
Portfolio
WEB DEVELOPMENT

Transplant Interface
Client: A Team of Nephrologists Located in Pittsburgh, PA
Purpose: Develop a user-friendly website that consists of a kidney-doner database that allows users to access transplant data on every US transplant center easily, locate the nearest center, compare transplant metrics (number of transplants, waitlists, and survival rates for adults and pediatrics, to name a few), and initiate transplant evaluation for select transplant centers.
Essential Tools: Google Map API, Google Directions API, JavaScript, Velo by Wix
Mission Leadership
Client: A Recruiting Firm Located in Franklin, TN
Purpose: Design and implement a user-friendly website and database interface that meets three goals. One, allow companies to create profiles and post job opportunities. Two, enable users to search for jobs, create profiles, and submit application materials. Three, provide recruiters with an easy-to-use interface for managing data and submitting reports.
Essential Tools: JavaScript, Velo by Wix
Links: Sample 1 | Sample 2

MOBILE

VISUALIZATIONS
3-D Model
Lorem ipsum dolor sit amet, consectetur adipiscing elit, sed do eiusmod tempor incididunt ut labore et dolore magna aliqua. Sed ullamcorper morbi tincidunt ornare massa eget.


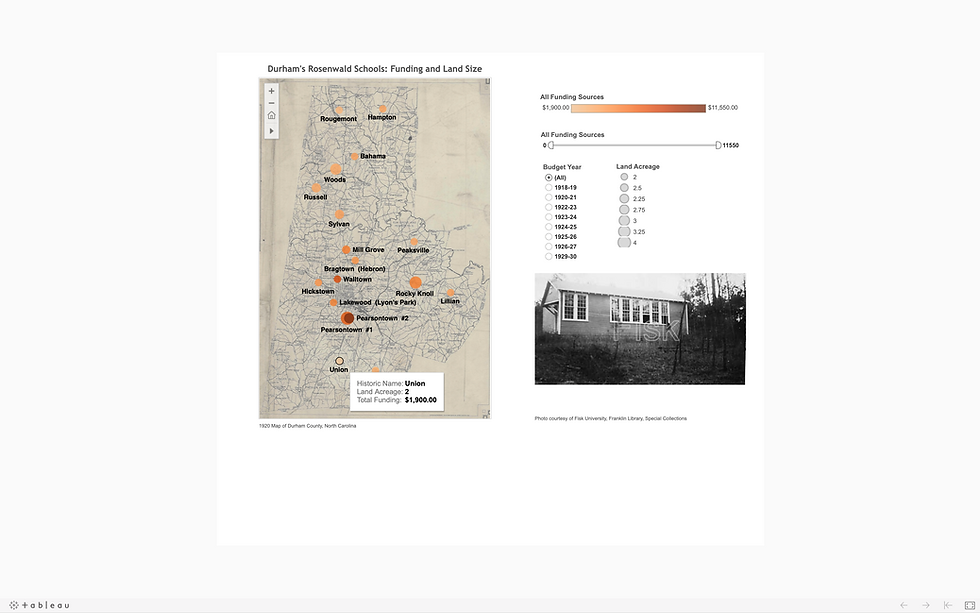
Tableau
Client: National Trust for Historic Preservation: Rosenwald Conference
Purpose: The Rosenwald School Database doesn't support comparing salient data in an easy-to-use format. This project demonstrates how visualization tools like Tableau impact users' understanding of Rosenwald data, create visually interactive experiences and generate novel interpretations. Instead of scrapping the database for all 5000 entries and transposing them into Tableau, I focused on North Carolina schools in Durham, Orange, and Wake counties.
Tools: Tableau, Duke University Georectification Software, ParseHub
Links: Example 1 | Example 2 | Example 3 | Video presentation
Note: Example 1 utilizes Duke University's Georefencing Software to create a map of 1920 Durham County that aligns spatial data to a geographic grid.


